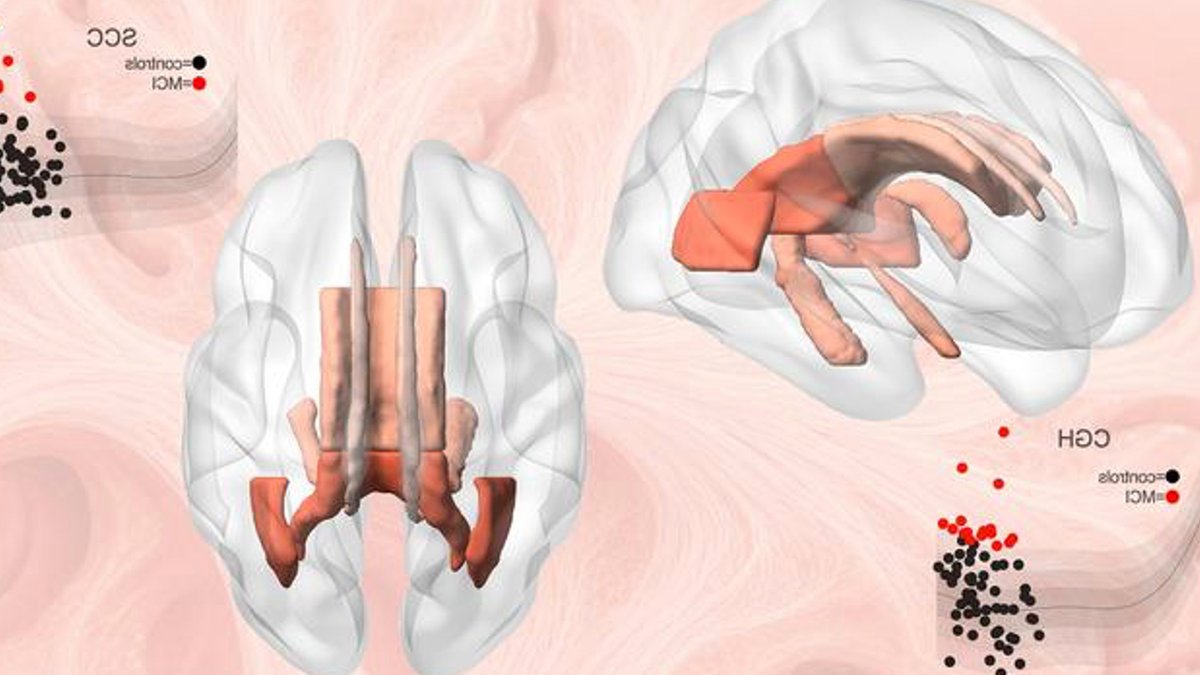
Researchers have established a standardized model of human brain white matter, mapping changes from childhood into late adulthood. Published on 27 May 2026, the study provides a reference tool for clinicians to identify neurological departures from typical development or aging patterns. By using growth-chart logic for the brain’s internal wiring, the team aims to improve diagnostic sensitivity for conditions like Alzheimer’s disease.
White matter acts as the brain’s communication network, consisting of fibers that transmit signals between regions. The research team from the USC Mark and Mary Stevens Neuroimaging and Informatics Institute aggregated diffusion MRI data from 54,583 individuals. These participants, aged 4 to 91 years, were drawn from 19 international datasets. The resulting atlas covers 22 distinct regions of interest, offering a granular view of how neural pathways evolve over a lifetime.
Related: Turning awareness into cancer appointments
To address the inconsistencies inherent in multi-site imaging, the scientists utilized hierarchical Bayesian regression. This statistical method accounts for variations in scanner hardware and protocols without discarding biological data. The model provides centile curves, allowing doctors to determine if an individual’s brain microstructure falls within the expected range for their specific age and sex.
Moving toward individualized medicine requires shifting away from broad group averages, which often mask the specific ways a disease manifests in a single patient. By focusing on how a person’s unique brain architecture deviates from a normative baseline, the team can better account for the high level of biological variability that exists even among people sharing the same clinical diagnosis.
Related: Common ENT Problems in Kids: Symptoms Every Parent Should Know
Beyond diagnostics, these charts offer a method for evaluating the effectiveness of therapies. By tracking whether a patient’s metrics move toward age-expected centiles, the authors may be able to monitor the impact of treatments for multiple sclerosis or other psychiatric conditions.
The project, which took seven years to complete, provides an open-access framework for the scientific community. While the authors acknowledge limitations regarding data for children under five and the need for broader ethnoracial representation, the current version is being applied to more than 30 different neurological conditions.





Leave a Reply